Our enterprise level data publication includes transaction level data to show what social investment is flowing to charities, social enterprises, social purpose organisations or property assets and who is accessing it. This transaction level data provides an opportunity to identify the types of organisations using social investment to better target growth and identify gaps in the market to better understand who might not be accessing social investment and why.
As part of our enterprise level data release, we build an open data set to encourage other investors to share their data and demonstrate the impact that social investment is having to front line organisations.
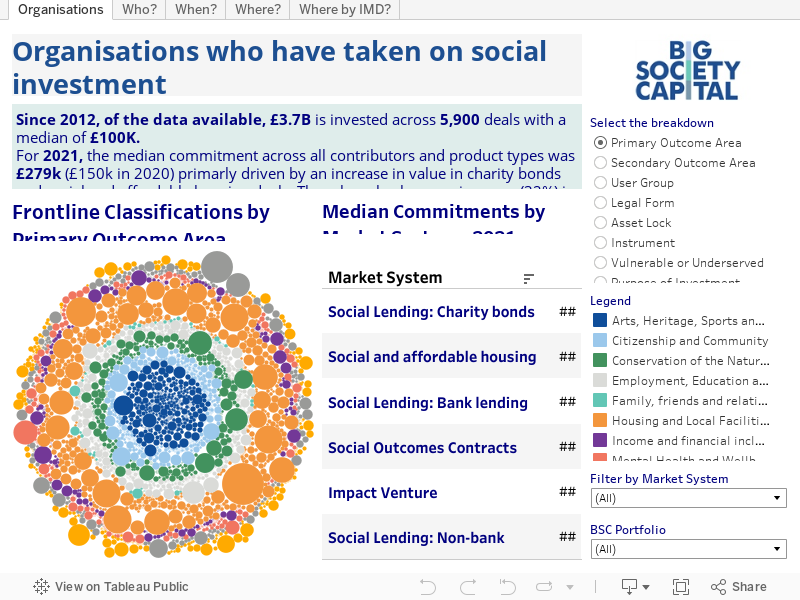
- The latest figures (as of December 2021) now capture over 5,900 commitments over the last 10 years totalling £3.7 billion of investment into social purpose organisations such as charities and social enterprises, start ups or real assets such as social and affordable housing.
- Our enterprise level data includes over £633 million of new commitments made in 2021 into 650 organisations.
- Since the last publication (as of December 2020, released in October 2021), there has been an increase of £800 million worth of commitments across <800 new commitments. £165 million of this growth was driven from contributors providing new historical enterprise level data from previous years.
We note that this is not a complete set of all social investment activity in the UK, but a voluntary collaborative effort. We would like to thank all those who have contributed to this release.
Use the tableau visualisation above to explore the data set. In particular:
- Organisations: Which charities, social enterprises and social purpose organisations have received investment? What legal forms are they? What outcome areas or beneficiary groups do these charities and social enterprises focus on?
- Who: Who has contributed to the enterprise level data? What outcome areas and user groups are the organisations focused on? What are the legal forms or asset lock of these organisations? What financing mechanisms do these contributors invest into charities and social enterprises by?
- When: What new deals are there? Who contributed to these deals and what are the trends over time? What has been the focus of these investments over time?
- Where: Which areas of the UK have received social investment? Who contributed to deals in each region? How do the investments map to the Indices of Multiple deprivation?
- £229 million of investment activity in 2021 was committed through funds and intermediaries across 280 commitments with a median investment of £100,000 (£50,000 in 2020). This includes £7 million of investments through the social investors who are delivering the Access Growth Fund.
- £397 million was committed by social banks across 353 commitments into charities, social enterprises, and social purpose organisations, with a median investment of £589,000 (£655,000 in 2020).
- The remaining £6 million of 2021 activity is spread across seventeen commitments into charities and social enterprises made my foundations and trusts, with a median investment of £320,000 (increase from £250,000 in 2020).
- A core aim of this data set is that all organisations are classified with a primary outcome area and beneficiary group as per the Outcome Matrix, to show us how social investment is used. This can help us see where social investment is appropriate and where it can enable the greatest impact.
- For 2021, the top three outcome areas by no. of commitments in the current data set are citizenship and community, conservation of the natural environment and employment, education, and training. By value, the top three are citizenship and community; housing and local facilities; and physical health. These differ depending on the contributor and the data covers all nine outcomes areas as identified in our Outcome Matrix.
- It is worth noting that there are still plenty of ‘nulls’ in this data set where data has not been provided (i.e., outcome area has 26% nulls, user group has 48% nulls). Reducing these nulls over time and providing unique identifiers (company numbers and/or charity numbers) will increase the usefulness of this dataset dramatically for decision-making purposes.
For a comprehensive estimate of the size and composition of social investment in the UK, please see our 2021 Market Sizing data. Our 2021 Market Sizing data highlights deal flow of £1.6 billion which includes more commitments than our deal level data of £630 million in 2021. This is due to the granularity required for our deal level data publication which is often not publicly available, and we do not ask all collaborators to our market sizing to submit deal level data. Most of this difference is due to new social and affordable housing and impact venture funds not included in the enterprise level data to December 2021. For Social Lending in 2021, 71% of our market sizing data is included in our deal level data (£470 million in our deal level data of commitments compared to deal flow of £677 million in our market sizing).
We hope you find the enterprise level data a useful resource whether you are a social investor or an organisation raising investment. The next release of the deal level data will be for 2022 and will be published in 2023. If you are interested in contributing to our open data set, please get in touch.

