The latest figures (December 2019) now capture over 4,300 commitments to invest into social enterprises and charities totalling £2.5 billion.
Since the last deal level data release in June 2019, there has been an additional £544 million worth of commitments (across 698 transactions ) into 380 charities and social enterprises. The remaining growth was primarily driven from contributors providing new historical deal level data.
We note that this is not a complete set of all social investment activity in the UK, but a voluntary collaborative effort. We’d like to thank all those who have contributed to this release.
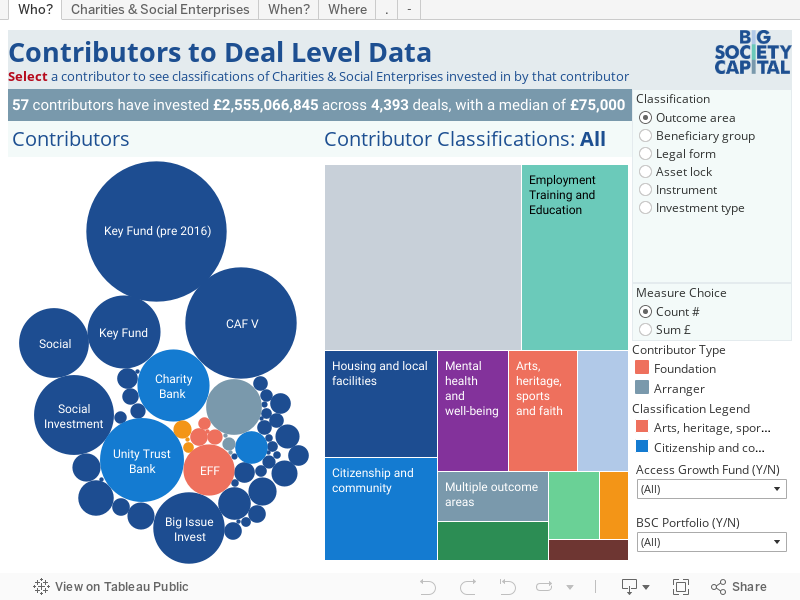
Use the tableau visualisation above to explore the data set. In particular:
- Who: Who has contributed to the deal level data? What outcome areas, beneficiary groups, are they focused on? What are the legal forms or asset lock of these deals? What financing mechanisms do these contributors invest into charities and social enterprises by?
- Charities & Social Enterprises: Which charities & social enterprises have received investment? What legal forms are they? What outcome areas or beneficiary groups do these charities and social enterprises focus on?
- When: What new deals are there? Who contributed to these deals and what are the trends over time? What has been the focus of these investments over time?
- Where: Which areas of the UK have received social investment? Who contributed to deals in each region?
The majority of investment activity in 2019 is comprised of funds and intermediaries (£283 million) across 366 commitments into charities and social enterprises with a median investment of £70,000 - this includes £24 million of loans through Social and Sustainable Capital (median size of £1.6 million) and £12 million of loans through the social investors who are delivering the Access Growth Fund (median size of £50,000 ).
£232 million was committed by social banks across 195 commitments into charities and social enterprises, with a median investment of £617,000. The remaining £7 million of 2019 activity is spread across 18 commitments into charities and social enterprises with a median investment of £295,000.
A core aim of this data set is that all charities and social enterprises are classified as having a primary outcome area and beneficiary group as per the Outcome Matrix, to show us how social investment is being used. This can help us see where social investment is appropriate and where it can enable the greatest impact.
The top three outcome areas by count in the current data set are employment, training and education; housing and local facilities; citizenship and community. By value the top three are housing and local facilities; employment, training, and education; arts, heritage, sports and faith. These differ depending on the contributor.
It is worth noting that there are still plenty of ‘nulls’ in this data set where data has not been provided (e.g. outcome areas has 20% nulls, beneficiary groups has 33% nulls). Reducing these nulls and providing unique identifiers (company numbers and/or charity numbers) will increase the usefulness of this dataset dramatically for decision-making purposes.
For a comprehensive estimate of the size and composition of social investment in the UK, please see our 2019 Market Sizing data. We hope you find the Deal Level Data a useful resource whether you are a social investor or a social enterprise raising investment. The next release of the deal level data will be for 2020 and will be published autumn of 2021.

