Alongside our Market Sizing estimate, we publish our enterprise level data which shows transaction level data to show what social investment is flowing into social purpose organisations such as charities, social enterprises, start-ups, or real assets such as social and affordable housing.
Our market sizing looks at social investment from the impact managers lens (i.e. the intermediaries capital flows through) and the value of social investment being committed and repaid in that current year, whereas enterprise level data looks at it from an impact makers lens by looking at the organisations being invested into overtime.
What is enterprise level data and why do we collect it?
Our enterprise level data is aimed at building transparency in the social impact investment market. We do this by sharing an annual open data set collated from generous collaborators that includes transactional level data to show how social investment is being used by charities, social enterprises, and social purpose organisations over time. This publication has previously been called deal level data and has been reframed as enterprise level data to better represent the data it provides on the enterprises taking on social investment.
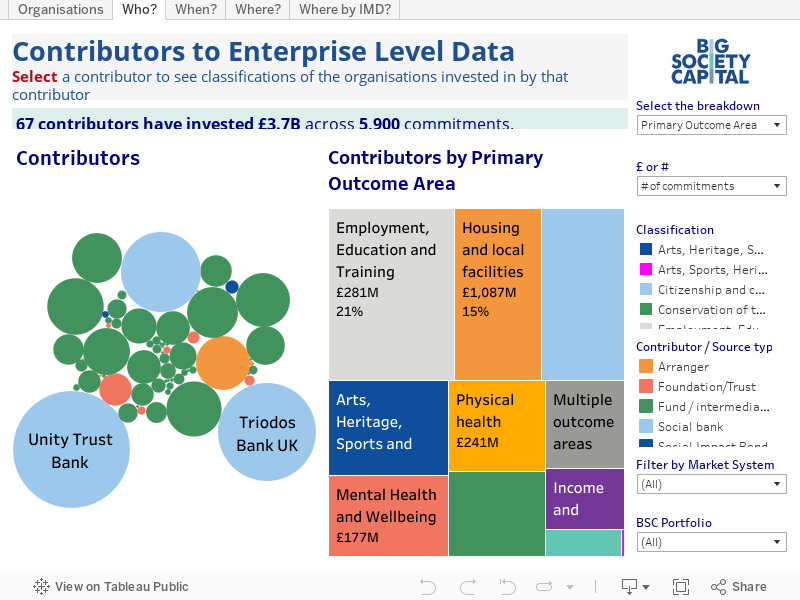
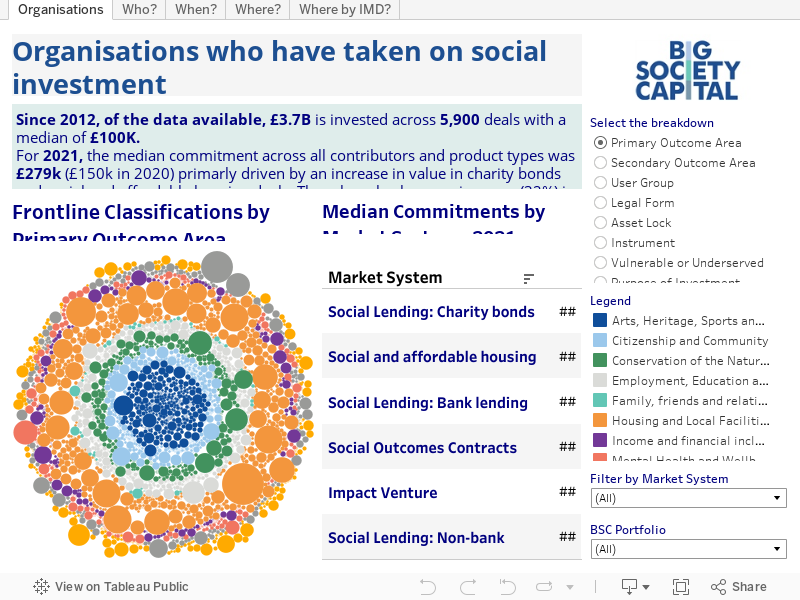
Our enterprise level data now captures over 5,900 commitments (over the last ten years) to invest into charities, social enterprises, and social purpose organisations totalling £3.7 billion.
- The data includes over £633 million of new commitments made in 2021 into 650 organisations.
- This demonstrates a 23% increase from 2020 which included £516 million of investment in 2020 across 825 commitments.
- Since the last publication (as of December 2020, released in October 2021), there has been an increase of £800m worth of commitments across <800 new commitments. £165m of this growth was driven from contributors providing new historical enterprise level data from previous years.
Where have social investments been made?
Our data shows over 82% of commitments were made to organisations based outside of London, with the Yorkshire and Humber region receiving the largest number of investments of any region (28% of total commitments). Explore our regional data here.
The data also shows that social investment is reaching those in the most deprived areas in the UK with 60% of commitments located within IMD (index of multiple deprivation) Quintile one or two (covering the 40% most deprived Lower Layer Super Output areas (LSOA’s)).
33% of commitments have been made within levelling up priority one areas resulting in over £670m of investment into more than 1250 organisations.
Despite the data showing that investment is reaching all UK regions and positively weighted in areas of deprivation, we know there is more that can be done to address the regional inequalities that exist, and that we believe social investment has a key role to play in reducing these gaps.
What outcomes are being achieved?
Employment, education, and training is the largest outcome area with 21% of commitments being made to organisations delivering in this area. This is followed by housing and local facilities (15%) and citizenship and community (14%). By value, the largest outcome area is housing and local facilities (36%) with over £1 billion worth of investment across 635 commitments. This is followed by conservation of the natural environment (10%) and employment, education, and training (9%). The range of commitments are broadly spread across our nine outcome areas as per our Outcome Matrix which demonstrates the broad range of outcomes social investment in the UK is currently achieving.
Which user groups are being targeted?
Excluding investments focusing on the general population, people living in poverty and/or financial exclusion is the largest user group and beneficiaries of social investment (12% of commitments made). The second and third largest user groups are vulnerable young people and vulnerable older people (10% and 8% of commitments made). By value, the largest user group is also people living in poverty and/or financial exclusion (excluding general population) with over £375 million of investment across more than 370 commitments. The second largest user groups are vulnerable older people (12%) and people experiencing homelessness (8%). Similarly, to the outcomes, the commitments are spread across the broad range of 16 user groups, demonstrating the reach social investment is having to the most vulnerable and underserved in society. The smaller user groups are refugees, asylum seekers or undocumented and other migrants and vulnerable parents. This may be because these were new user groups added for the 2021 data collection and/or could highlight areas that may be currently underserved through social investment.
What types of organisations are taking on social investment?
Our enterprise level data aims to illustrate the broad range of organisations taking on social investment. This data set includes a broad variety of differing legal forms from sole trader organisations to companies limited by shares. For those organisations that provided us with their asset lock, 36% stated they were a charity, 20% were community interest companies or community benefit societies and 18% stated they had no asset lock. You can filter on asset lock and legal form within the visualisation below to understand this breakdown further. This broad range of legal forms and asset locks highlights how social investment is now being utilised by a variety of organisations, many of whom may have been previously unable to take on social investment due to market growth and development.
How does social investment improve an organisations resilience and growth?
As part of our enterprise level data, we want to understand more about the impact social investment can have on these organisations in improving their resilience and growth.
We recently ran a pilot enterprise level impact survey to learn more about this, which you can read more about here. The pilot involved creating a new framework to understand why organisations take on social investment and how they use the proceeds. Building upon this, we gathered financial data to understand how the organisations had fared financially since receiving investment and followed up with investees to get their perspective. Pilot findings suggest social investment can have a positive impact on growth and resilience at both a financial and organisational level and we are looking forward sharing these findings in more detail in our report shortly.
Being transparent
We note that our enterprise level data is not a complete set of all social investment activity in the UK, but a voluntary collaborative effort. Through publishing the open data set, we are aware we can play a key role in encouraging others to share their data and improve market transparency.
We’d like to thank all those who have contributed to this release. If you are interested in contributing to our enterprise level data set, please get in touch. You can find our market sizing estimate publication here.


