In 2016, we produced our first comprehensive estimate of the size and composition of social investment in the UK. Two years on, we’ve updated the central data in this report for the end of 2017 and highlight some emerging trends.
We continue to produce these estimates to take stock of progress in developing social investment, and to gauge how relevant it is becoming as a tool for charities and social enterprises. As an organisation we define social investment as “repayable finance for charities and social enterprises that targets both financial and social returns”.
The key headlines are as follows:
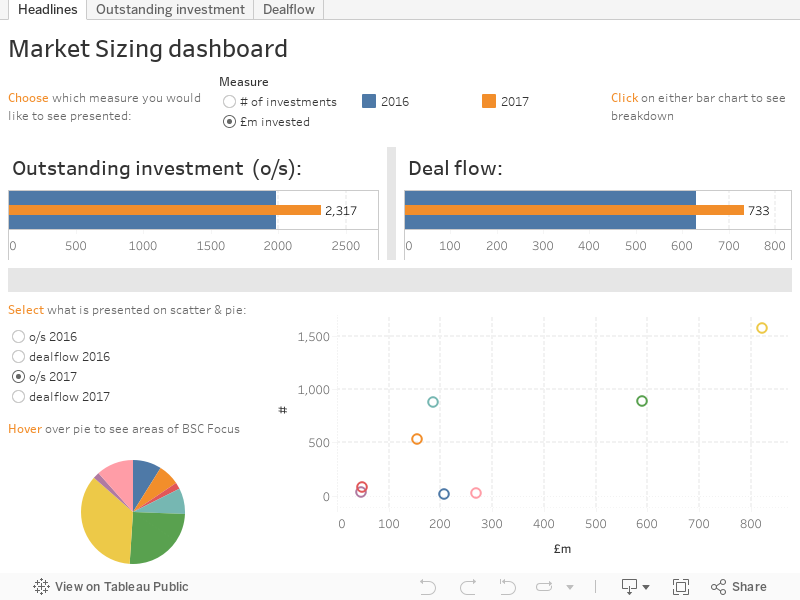
- Social investment in the UK is worth over £2.3 billion, spread across approximately 4,000 transactions. This is the value of social investments outstanding at the end of 2017, a 17% (~£335 million) increase year-on-year (y-o-y) and 50% vs the end of 2015.
- The bulk of this increase is due to Social Bank lending, Charity Bonds and profit-with-purpose investment.
- Despite non-bank lending deal flow of £65m, the amount of non-bank lending outstanding has dropped to £186m which suggests there have been repayments.
- With approximately 4,000 transactions outstanding at the end of 2017 (including over 800 profit-with-purpose) we are confident over 3,000 different charities and social enterprises have benefitted from social investment.
- Social investment deal-flow in the 2017 calendar year saw around £730 million of deals committed to around 1,100 charities and social enterprises, an increase vs £630 million of deals in 2016 though the number of charities and social enterprises taking investment y-o-y was roughly unchanged.
- The 16% growth in deal flow over 2017 is driven by significant profit-with-purpose deal flow and Charity Bond issues, offset by a reduction in Social Property deals.
- Investments in social property, declined significantly from £130 million in 2016 to £39 million in 2017 (vs ~£50 million in 2015). It is perhaps unsurprising that the sizable and episodic nature of property investments can lead to large variances.
- During 2017 there was a significant increase in Social Impact Bond (SIB) deal flow to £10m (£2m in 2016) resulting in a 30% increase in the amount of Social investment outstanding in SIBs (£46m vs £36m).
At BSC we also collate the ‘Deal Level Data’ twice a year. This is transaction level data and in 2017 showed deal flow of £240m as compared to £710m in this Market Sizing estimate. Most of the difference is due to Social Bank lending as UTB and Triodos were not included in the Deal Level Data to December 2017. UTB will be included in the June 2018 Deal Level Data.
A note on profit-with-purpose. In our 2016 report on market sizing we classified Social Investment as where both Investors and Investees had social intent (see figure 1, segment A) and then we sub divided this segment into 2 parts (see figure 2); A1 being the emphasis of Big Society Capital investment activity and segment A2 being profit-with-purpose. We have used this same classification in both subsequent updates.
A note on social property funds. The last 2 years have seen the emergence and listing of a number of social real estate investment trusts (REITs), listed funds which buy or forward fund social and supported housing and lease it to local authorities and housing associations. Between them, Civitas, Triplepoint Social Housing and Residential Secure Income raised £1bn on listed markets since November 2016, and around three quarters of this has been invested. This model is not dissimilar to that of some of the social property funds included in the market sizing, but there are also differences. As noted above, this market sizing estimate focuses on those investments where both the investor and user/investee explicitly have social intent (defined as Segment A). Although much of the capital invested by social REITs is channelled to organisations with a social purpose, it is less apparent that the investors in these funds have explicit social intentions. As a result – and to aid y-o-y comparison given the size of these funds – we have not included Social REITs in this year’s market sizing. However, we note that some funds such as Civitas do publish an impact report with a stated social purpose, theory of change and impact metrics, so we will revisit this decision for future estimates.
We will continue to update this estimate annually, as we continue to make advances in data and transparency. Thank you to all the investors who have provided their data to enable this update.
For those Charities and Social Enterprises looking to make sense of the social investment landscape and to make informed choices about whether and how to access what is on offer, Good Finance is available.