Number of charities and social enterprises using social investment in 2016 continues to grow.
Charities and social enterprises took up 50% more non-bank capital than in 2015.
In March 2016, Big Society Capital released a report entitled The size and composition of social investment in the UK. We have now updated the central data in this report for the end of 2016.
The key headlines are as follows:
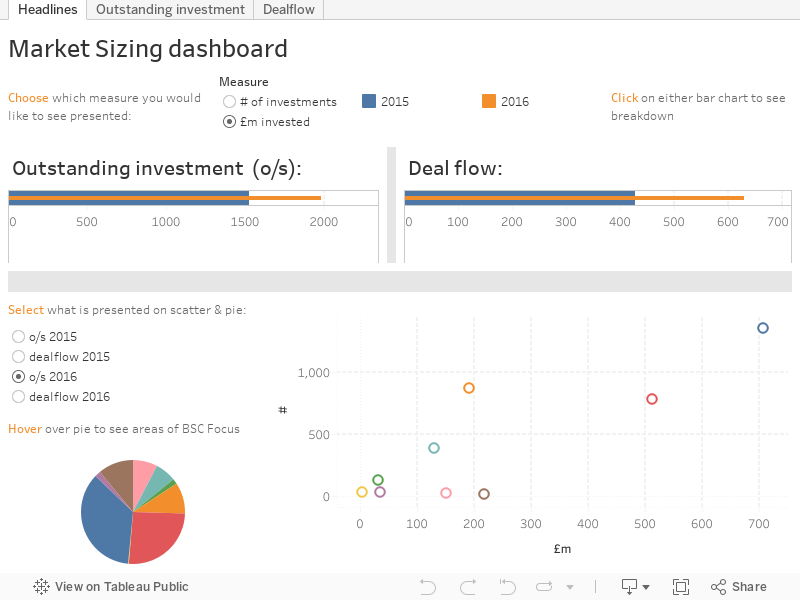
- Social investment in the UK is worth at least £1,950 million. This is the value of social investments outstanding at the end of 2016, a 30% (~£450 million) increase from the end of 2015.
- Big Society Capital’s own social investment portfolio outstanding at the end of 2016 was £142 million or £467 million when including our co-investors. This represents c.7% or 24% of the value of UK social investment respectively - at the end of 2015 this was c.4% or 13%.
- There are over 3,600 different social investments outstanding at the end of 2016 – a 5% increase from the end of 2015. We are confident this means at least 3,000 different charities and social enterprises are benefitting from social investment.
- Social investment deal-flow in the 2016 calendar year saw around £630 million of deals committed to around 1,100 charities and social enterprises, versus £427 million (around 950) in 2015.
- Most significantly, the flow of non-bank capital continues to grow faster than the market. In 2016 there was £326 million of non-bank investment deal flow compared with £216 million in 2015: increasingly providing investment options to meet the diverse finance needs of the sector – both small scale and large. Non-bank capital includes the following product groups: charity bonds, community shares, equity-like capital, non-bank lending, and profit-with-purpose (non-bank portion), SITR products, social impact bonds & social property.
- There was significant growth in the year in investments in social property, from £51 million in 2015 to £130 million in 2016. This supports charitable service delivery such as through Resonance’s and St Mungo’s National Homelessness Property Fund.
- The average deal size in the non-bank lending segment is £144k in 2016 (£108k in 2015). The reason for the increase is that Key Fund lent less than normal in 2016 and Key Fund is usually a major provider of small loans.
We have done this updated estimate to take stock of progress in developing social investment, and to gauge how it is being used by charities and social enterprises. Our support for Good Finance aims to help charities and social enterprises to make sense of the social investment landscape and to make informed choices about whether and how to access what is on offer.
We will update this report annually, as we continue to make advances in data and transparency. Thank you to all the investors who have provided their data to enable this update. Clearly more important than the numbers is the positive impact this is having on lives around the country.
We have used Tableau to visualise this update to enable us all to see the data more clearly, and ultimately to drive more informed insights & decision-making. This is the first of a number of data visualisations that we will release in the coming months, which will allow each user to drill down into the data, following their own lines of enquiry.
You can download the Tableau file using the links in the data visualisation.