In our third data dives into social investment, we look at the revenue sources and business models being used by charities and social enterprises to create, sustain or grow their positive social impact.
This is a bit different from our previous data dives, in that this time we’ve gone beyond what is in the current data fields, and followed our curiosity to test what might be possible if we were to collate information on revenue source and business models more systematically*.
Why did we want to explore this? At Big Society Capital all our work starts with the social issue, and then understanding the business model, its financing needs and where new products can connect with potential investors. In 2013 we first set up issue based groups to build a better understanding of these revenue sources and business models. In 2016 we started to share some maps of the emerging themes we were seeing. We are now hoping to use open data to build a more complete picture with partners over time.
So, using public information, we had a go at generating some categories of revenue source and business model and allocating investments from the deal level data to each of them. These categories aren’t based on any industry standard definition – and we haven’t asked the intermediaries or charities to validate our assumptions (yet!).
We’ve almost certainly got some of it wrong – so please get in touch if you disagree! We’re also planning to include revenue source and business model as fields within our 4th deal level data release scheduled for early 2018, and we’ll refine these categories based on feedback.
So what we’d really like to know from you is:
- Is this helpful and worthwhile?
- How can we work with you as data contributors or users of the data to improve and refine the categories?
We have classified each frontline as using one of three revenue sources and one of nearly 50 business models. Use this visualisation to explore the data:
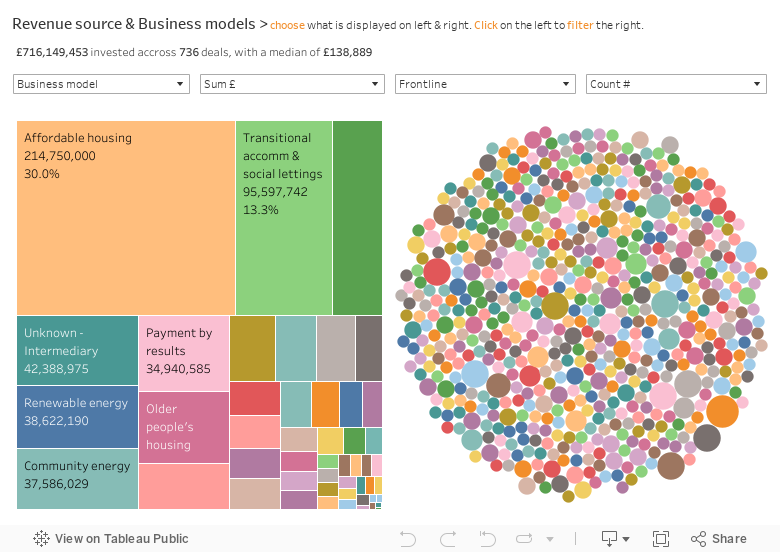
The revenue source refers to the primary revenue source. We recognise that for many charities and social enterprises, they have a mix of sources of revenue. But to keep it simple, we’ve attributed to each investment a single revenue source from one of the three options: “People via Government” (where government pays but the funding is attached to the individual – e.g. housing benefit or personal budgets, and we’ve also included community energy in here), “consumers/businesses” and “government direct” (e.g. directly contracted or commissioned services).
The business models are more descriptive – some are quite broad (e.g. affordable housing, and inclusive arts and heritage), others pretty specific (e.g. personal finance, and disability services.) And we’ve grouped all payments by results together, despite the fact that this captures a wide range of needs and interventions. There is definitely some more work to do on refining and improving these categories and we’d like your help to do this.
The data shows that the most common revenue source or business model is highly dependent on whether £ sum (i.e. value) or # count (i.e. number) is used as the measure. The most common revenue source by # number is “Consumers / Businesses” (49%) but by £ sum it is “People via Government” (59%). Affordable housing is the top business model (out of nearly 50!) with 30% of £’s invested, but only 3% by number (although this data does not include secured loans by the social banks, which would likely increase the number of housing investments).
Over the whole data set the top 3 business models by count are: payment by results, inclusive art & heritage and community enterprise (and this is before including community shares). Interestingly when Revenue source is filtered to “Government direct” then 49% of charities and social enterprises in this data set are using a “payment by results” business model, or 56% by £ sum invested – albeit across six different outcome areas. However, when revenue source is filtered to show just “People via Government” the top three business models (by # count) change to: community energy, affordable housing and supported living.
*More caveats…
This is not a representative sample of all the investments that are happening in social investment. For this initial analysis of Revenue source and Business model we have used the deal level data from June 2017, excluding Charity Bank, CAF Venturesome & ClearlySo deals as names are not provided. We have also excluded nearly 1,000 Key Fund (pre 2016) loans in the interests of time. This leaves a dataset of approx. 700 deals totalling approx. £700m with a median investment of approx. £135k made between 2004 and 2017, out of an original data set of 2,198 totalling £1.06bn. It also does not yet include community shares.
Next up in our Data Dives series we will be looking at portfolio allocation, the previous two in the series have focused on Deal Level Data and the Big Society Capital portfolio. We hope you are finding this series interesting and helpful. If you have any questions or feedback please do get in touch.
